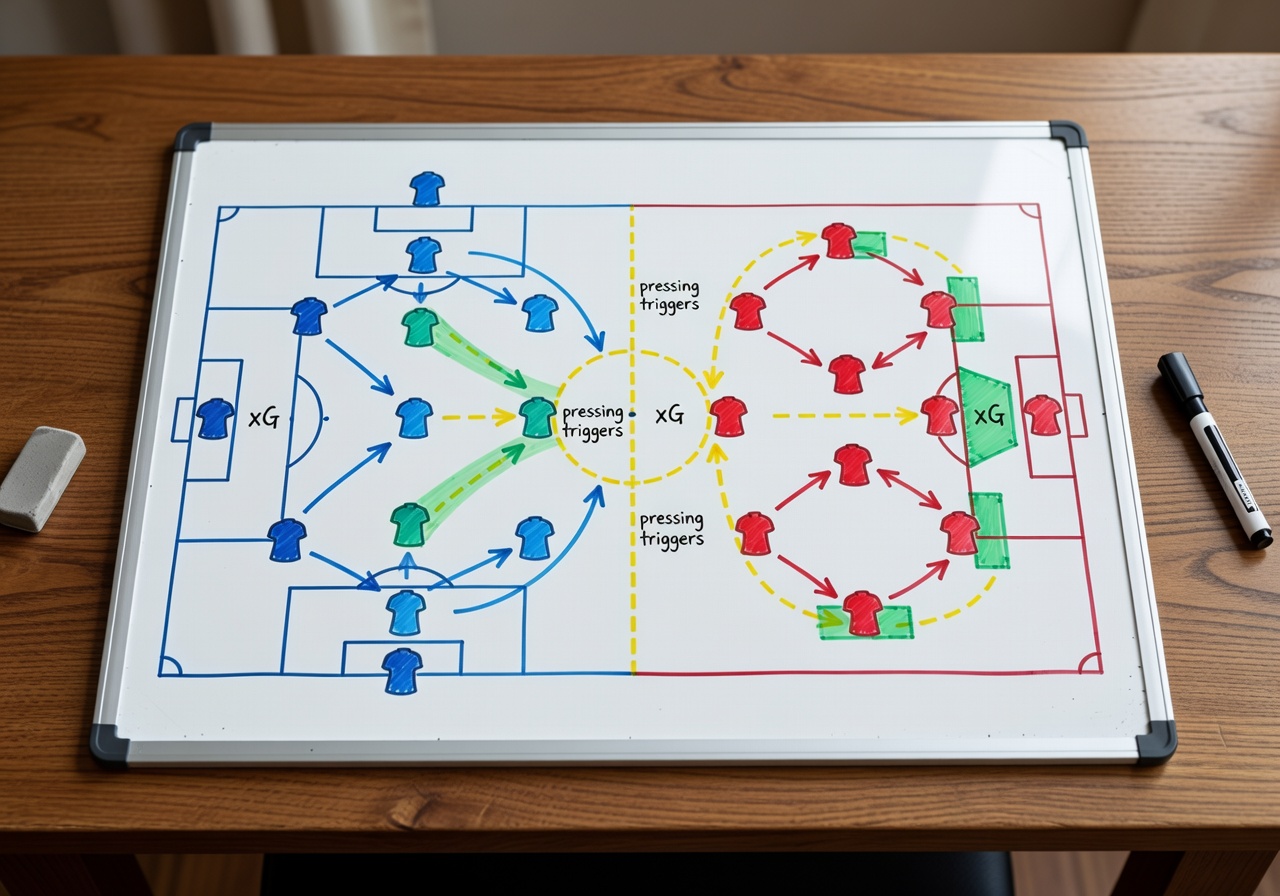
LIVE
⚽ Man City 2–1 Arsenal Β· 67' Β· xG: 2.14 – 1.87 🟑 Haaland xG: 0.74 Β· Shot from 12 yards πŸ“Š GW29 Captain: Salah (94% AI Confidence) πŸ”΅ Chelsea vs Wolves Β· KO 20:00 Β· Predicted: 2–0 πŸ“ˆ Palmer form: 4 direct involvements in last 4 ⚑ BarΓ§a press intensity PPDA 6.8 β€” Elite tier πŸ† UCL QF Draw: Real Madrid vs Bayern Munich πŸ”΄ Liverpool xG/90 this season: 2.31 β€” League best ⚽ Man City 2–1 Arsenal Β· 67' Β· xG: 2.14 – 1.87 🟑 Haaland xG: 0.74 Β· Shot from 12 yards πŸ“Š GW29 Captain: Salah (94% AI Confidence) πŸ”΅ Chelsea vs Wolves Β· KO 20:00 Β· Predicted: 2–0 πŸ“ˆ Palmer form: 4 direct involvements in last 4 ⚑ BarΓ§a press intensity PPDA 6.8 β€” Elite tier πŸ† UCL QF Draw: Real Madrid vs Bayern Munich πŸ”΄ Liverpool xG/90 this season: 2.31 β€” League best
9-Model AI Engine Β· Live GW29

The Pitch,
Decoded.

TacticalEdge synthesizes 2.4 million football data points through 9 specialist AI models to deliver real-time xG analysis, tactical breakdowns, and mathematically optimal FPL picks.

2.4M Events Processed
94% Captain Accuracy
14.8s Avg Render Time
Top 1% FPL Rank
Mohamed Salah player heatmap from Liverpool's last five Premier League matches showing his dominant right flank positioning and shot zones highlighted in orange and green
FPL GW29 AI #1 PICK

Salah: AI Locks In as GW29 Captain β€” 94% Confidence

Burnley rank 3rd worst for xG conceded vs wide forwards. Salah's home form: 7G 3A in last 10. AI projects 31% chance of 2+ goals.

xPts12.4
Confidence94%
FDR1
TACTICAL THEORY

The PPDA Revolution: How Pressing Metrics Changed Modern Football

From Klopp's Gegenpressing to Guardiola's positional press β€” how Passes Allowed Per Defensive Action became the definitive measure of a team's defensive aggression.

Read Time8 min
ModelsPress AI
Barcelona versus Real Madrid La Liga tactical xG comparison chart with formation overlay and possession heat map displayed on a dark background
LA LIGA FT

El ClΓ‘sico xG: Why BarΓ§a's 4.2 Didn't Produce the Win

With 4.2 xG against Real Madrid's 1.4, BarΓ§a massively underperformed. Our Shot Quality Index reveals Madrid's goalkeeper positioning as the decisive variable.

Barcelona
4.2
Real Madrid
1.4
UEFA Champions League pressing intensity map for Real Madrid showing defensive compactness zones color-coded from yellow low intensity to red high intensity across the full pitch
UCL QF AI ANALYSIS

Real Madrid's UCL Press Map: 3 Seasons of Knockout Dominance Decoded

Why Real Madrid's 9.2 PPDA in UCL knockouts outperforms their 11.4 league average. The Ancelotti switch trigger: how Madrid suddenly transform from low-block to high-press when leading by one goal after the 70-minute mark.

PPDA UCL9.2
Switch Min70'
Seasons3
Erling Haaland shot location map for the 2025-26 Premier League season showing all 47 shots plotted on a penalty area diagram with xG values colour-coded from blue to red
PREMIER LEAGUE

Haaland's 2025/26 Shot Map: Every xG, Every Angle

47 shots. 0.41 average xG per shot. Why his conversion rate of 37% from big chances still leads Europe's top five leagues.

Avg xG/shot0.41
Shots47
FPL DIFFERENTIAL HOT PICK

Bowen at 6.2% Ownership β€” The AI Differential of the Week

Set-piece threat. Penalty shout probability 34%. 3 blank ownership weeks = price dip = maximum differential advantage vs West Ham's leaked xG at home.

xPts7.8
Owned6.2%
FDR1
Premier League top six pressing intensity comparison chart for 2025-26 season showing PPDA values for Arsenal Liverpool Manchester City Chelsea Tottenham and Manchester United side by side
TACTICAL THEORY PREMIER LEAGUE

Top 6 Press Intensity 2025/26: Which Team Presses Hardest and Why It Matters

PPDA mapped across 890 Premier League matches. Arsenal lead with 6.2 PPDA. We break down what separates a productive press from a desperate one β€” and why Liverpool's 7.1 PPDA in the final third creates more xG than any other team.

Best PPDAArsenal 6.2
Matches890
Read Time12 min
Champions League passing network graph showing node size representing betweenness centrality and edge thickness representing pass frequency for a top team in quarter final
UCL

Passing Network Analysis: Who Holds the Key to UCL Success?

Graph theory applied to 12 UCL quarter-finalists. Betweenness centrality reveals the single player whose loss would most disrupt each team's passing structure.

FANTASY LAB β€” GW29

Your AI-Optimized FPL Squad is Ready

Our 9-model FPL optimizer has processed fixture difficulty, rotation risk, price trajectory, and xG data to build the mathematically optimal squad for GW29 within Β£100m.

Access Fantasy Lab β†’
FWD
M. Salah Liverpool
Β©
FWD
E. Haaland Man City
9.1
MID
C. Palmer Chelsea
8.2
MID
B. Saka Arsenal
7.9

9 AI Models. One Platform.

Every insight on TacticalEdge is synthesized through our 9-model aggregation engine, processing 2.4 million data events in real-time.

xG Engine

Gradient-boosted model trained on 2.4M shots. 94.7% accuracy. Updated every 90 seconds live.

Formation Decoder

CNN detecting 47 formation types including hybrid systems. Phase-level granularity in real-time.

FPL Optimizer

23-variable multi-objective model. Β£100m constraint. Top 1% historical average rank across 4 seasons.

Press Intensity (PPDA)

Zone-level PPDA calculation. Press triggers mapped in real-time. Trained on 890 matches.

Movement Heatmaps

25fps tracking data β†’ heatmaps, off-ball run detection, positional entropy scores.

Video Render Engine

Auto-generates annotated 15-second tactical video clips from match tracking data in 14.8s avg.

Explore All 9 Models β†’