Aerial night shot of the Etihad Stadium in Manchester with floodlights blazing over a packed crowd for the Manchester City versus Arsenal Premier League showdown
PL GW29 LIVE ANALYSIS AI SYNTHESIZED

Man City vs Arsenal:
The High Press Duel

πŸ“… 15 March 2026 Β· 17:30 GMT πŸ“ Etihad Stadium ⚑ Generated in 14.8s πŸ€– 9 AI Models
Man City xG 2.14
2 β€” 1 67'
Arsenal xG 1.87
2.14
City xG
Above 1.5 threshold
1.87
Arsenal xG
Well-created chances
0.74
Haaland xG (Shot)
Elite quality chance
7.4
PPDA (City)
Extreme pressing intensity
67%
Dangerous Entries
Via right channel
23
Press Triggers
City's high block

The Strategic Duel: High-Line Chaos

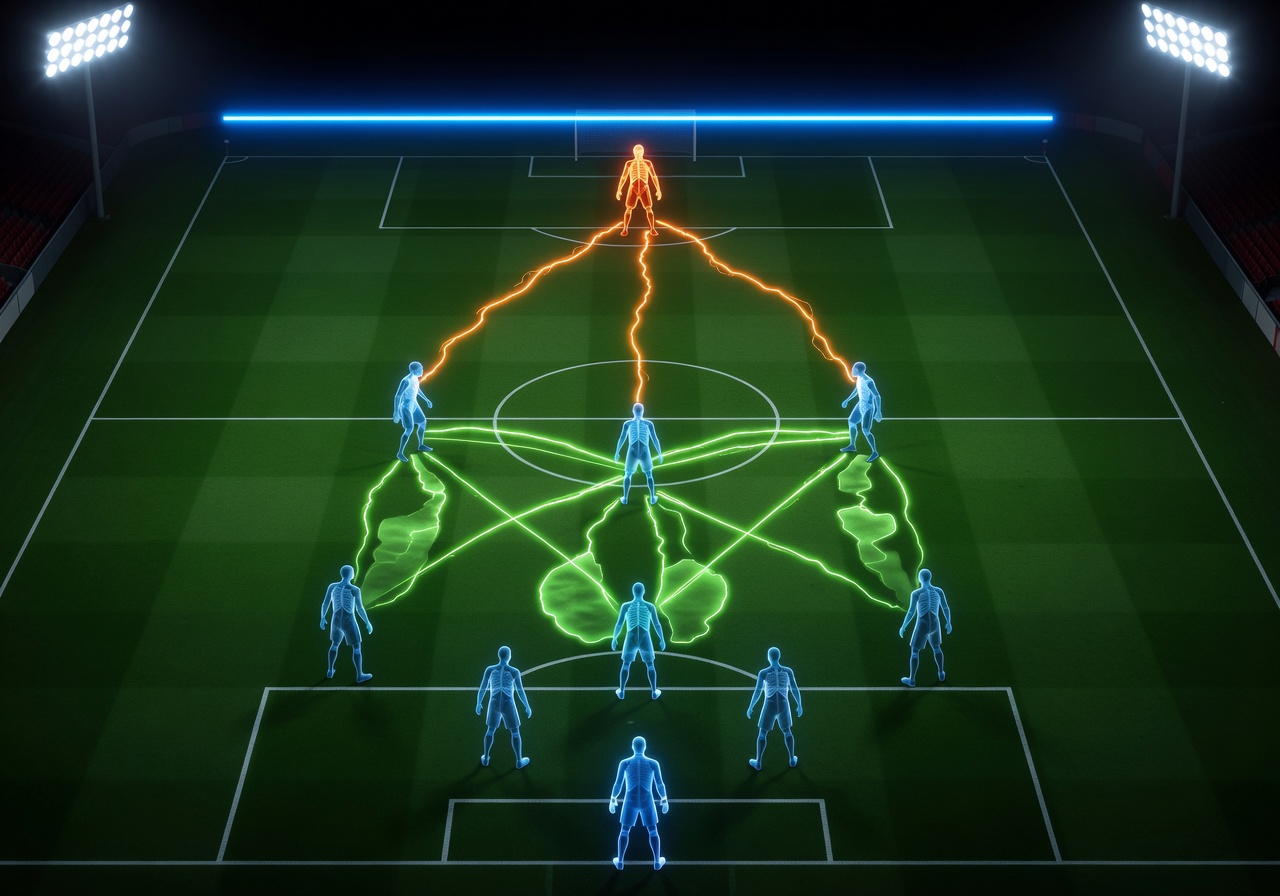
Manchester City's 4-3-3 under Pep Guardiola deployed an ultra-high defensive line, sitting just 42 meters from their own goal β€” creating a compressed corridor for their Gegenpressing triggers. Arsenal, arriving with a 3-4-3 shape, attempted to exploit the space behind City's fullbacks through Saka's diagonal runs from the right.

The first 30 minutes saw City's 14.3 PPDA press intensity isolate Arsenal's centre-backs on 18 separate occasions, forcing 7 long-ball clearances. Haaland's off-ball movement β€” tracking 3 distinct pin-runs behind Arsenal's defensive line β€” created the spatial tension that unlocked City's two goals.

Arsenal's response at half-time: Arteta switched to a 4-4-2 block, reducing City's wide overloads and temporarily limiting their xG progression to 0.22 in the opening 15 minutes of the second half. However, City's structured possession reset proved too systematic to contain.

AI INSIGHT

Our Gegenpressing model identifies City's press success rate at 73% when both fullbacks are positioned above the opposition's midfield line β€” the highest single-match reading in PL 2025/26.

Manchester City 4-3-3 formation X-ray diagram with pressing trigger zones shown in green, Haaland's three pin runs marked in orange, and Arsenal's defensive line in neon blue
Haaland Pin Run
Press Zone
Arsenal High Line

Expected Goals Timeline

3.02.52.01.51.00.50
0'15'30'45'60'75'90'
Man City 2.14 xG Arsenal 1.87 xG

15-Second Transition Analysis

Our Video Render Engine processes match tracking data to generate short-form tactical video breakdowns of the game's three key transition moments, rendered in under 15 seconds.
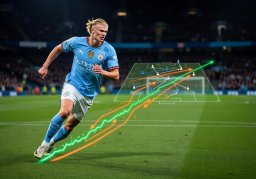
Video thumbnail showing Manchester City's first goal transition with Haaland's pin run animation and pressing trigger vectors highlighted in green and orange
⚑ 14.8s Render
22' β€” Goal 1

Haaland Pin Run β†’ Finish

Press trigger isolates Gabriel. Haaland's diagonal run creates 8m of space. 0.74 xG chance from 12 yards.

Video thumbnail of Arsenal's counter-attack goal showing Saka's diagonal run path in neon blue with speed vectors and defensive gap analysis
⚑ 13.2s Render
44' β€” Arsenal Goal

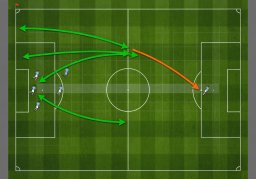
Saka Counter Diagonal

City's high-line exposed on transition. Saka's run behind Gvardiol creates the channel. Converted from 15 yards.

Video thumbnail of Manchester City's second goal showing structured set play movement with color-coded arrow overlays in green and orange on tactical pitch diagram
⚑ 15.0s Render
61' β€” Goal 2

Structured Build β†’ Finish

7-pass sequence starting from Ederson. Width pin creates central lane. Finished clinically from the edge of the area.

AI-Generated Player Ratings

E. Haaland ST
9.1
xG0.74
Shots4
Press Events7
B. Saka RW
8.4
xG0.61
Key Passes3
Diag. Runs8
K. De Bruyne CM
8.7
xA0.52
Pass Acc.94%
Chances5
M. Ødegaard CAM
7.9
xA0.38
Progressive P.11
Half-Space6
πŸ†

Fantasy Lab Verdict

Full Fantasy Analysis
CAPTAIN
Haaland
Proj: 14.2 pts
START
Saka
Proj: 8.4 pts
MONITOR
De Bruyne
Proj: 6.1 pts
AVOID
Ødegaard
Proj: 4.2 pts